Now that I’m recording basic statistics about the behavior of my machines, I now want to start tracking some statistics from various scripts I have lying around in cron jobs. In order to make myself sound smarter, I’m going to call these short lived scripts “ephemeral scripts” throughout this document. You’re welcome.
The promethean way of doing this is to have a relay process. Prometheus really wants to know where to find web servers to learn things from, and my ephemeral scripts are both not permanently around and also not running web servers. Luckily, prometheus has a thing called the pushgateway which is designed to handle this situation. I can run just one of these, and then have all my little scripts just tell it things to add to its metrics. Then prometheus regularly scrapes this one process and learns things about those scripts. Its like a game of Telephone, but for processes really.
First off, let’s get the pushgateway running. This is basically the same as the node_exporter from last time:
$ wget https://github.com/prometheus/pushgateway/releases/download/v0.3.1/pushgateway-0.3.1.linux-386.tar.gz
$ tar xvzf pushgateway-0.3.1.linux-386.tar.gz
$ cd pushgateway-0.3.1.linux-386
$ ./pushgateway
Let’s assume once again that we’re all adults and did something nicer than that involving configuration management and init scripts.
The pushgateway implements a relatively simple HTTP protocol to add values to the metrics that it reports. Note that the values wont change once set until you change them again, they’re not garbage collected or aged out or anything fancy. Here’s a trivial example of adding a value to the pushgateway:
echo "some_metric 3.14" | curl --data-binary @- http://pushgateway.example.org:9091/metrics/job/some_job
This is stolen straight from the pushgateway README of course. The above command will have the pushgateway start to report a metric called “some_metric” with the value “3.14”, for a job called “some_job”. In other words, we’ll get this in the pushgateway metrics URL:
# TYPE some_metric untyped
some_metric{instance="",job="some_job"} 3.14
You can see that this isn’t perfect because the metric is untyped (what types exist? we haven’t covered that yet!), and has these confusing instance and job labels. One tangent at a time, so let’s explain instances and jobs first.
On jobs and instances
Prometheus is built for a universe a little bit unlike my home lab. Specifically, it expects there to be groups of processes doing a thing instead of just one. This is especially true because it doesn’t really expect things like the pushgateway to be proxying your metrics for you because there is an assumption that every process will be running its own metrics server. This leads to some warts, which I’ll explain in a second. Let’s start by explaining jobs and instances.
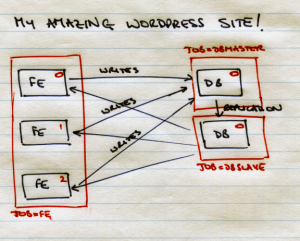
For a moment, assume that we’re running the world’s most popular wordpress site. The basic architecture for our site is web frontends which run wordpress, and database servers which store the content that wordpress is going to render. When we first started our site it was all easy, as they could both be on the same machine or cloud instance. As we grew, we were first forced to split apart the frontend and the database into separate instances, and then forced to scale those two independently — perhaps we have reasonable database performance so we ended up with more web frontends than we did database servers.
So, we go from something like this:

To an architecture which looks a bit like this:

Now, in prometheus (i.e. google) terms, there are three jobs here. We have web frontends, database masters (the top one which is getting all the writes), and database slaves (the bottom one which everyone is reading from). For one of the jobs, the frontends, there is more than one instance of the job. To put that into pictures:

So, the topmost frontend job would be job=”fe” and instance=”0″. Google also had a cool way to lookup jobs and instances via DNS, but that’s a story for another day.
To harp on a point here, all of these processes would be running a web server exporting metrics in google land — that means that prometheus would know that its monitoring a frontend job because it would be listed in the configuration file as such. You can see this in the configuration file from the previous post. Here’s the relevant snippet again:
  - job_name: 'node'
    static_configs:
      - targets: ['molokai:9100', 'dell:9100', 'eeebox:9100']
The job “node” runs on three targets (instances), named “molokai:9100”, “dell:9100”, and “eeebox:9100”.
However, we live in the ghetto for these ephemeral scripts and want to use the pushgateway for more than one such script, so we have to tell lies via the pushgateway. So for my simple emphemeral script, we’ll tell the pushgateway that the job is the script name and the instance can be an empty string. If we don’t do that, then prometheus will think that the metric relates to the pushgateway process itself, instead of the ephemeral process.
We tell the pushgateway what job and instance to use like this:
echo "some_metric 3.14" | curl --data-binary @- http://localhost:9091/metrics/job/frontend/instance/0
Now we’ll get this at the metrics URL:
# TYPE some_metric untyped
some_metric{instance="",job="some_job"} 3.14
some_metric{instance="0",job="frontend"} 3.14
The first metric there is from our previous attempt (remember when I said that values are never cleared out?), and the second one is from our second attempt. To clear out values you’ll need to restart the pushgateway process. For simple ephemeral scripts, I think its ok to leave the instance empty, and just set a job name — as long as that job name is globally unique.
We also need to tell prometheus to believe our lies about the job and instance for things reported by the pushgateway. The scrape configuration for the pushgateway therefore ends up looking like this:
  - job_name: 'pushgateway'
    honor_labels: true
    static_configs:
      - targets: ['molokai:9091']
Note the honor_labels there, that’s the believing the lies bit.
There is one thing to remember here before we can move on. Job names are being blindly trusted from our reporting. So, its now up to us to keep job names unique. So if we export a metric on every machine, we might want to keep the job name specific to the machine. That said, it really depends on what you’re trying to do — so just pay attention when picking job and instance names.
On metric types
Prometheus supports a couple of different types for the metrics which are exported. For now we’ll discuss two, and we’ll cover the third later. The types are:
- Gauge: a value which goes up and down over time, like the fuel gauge in your car. Non-motoring examples would include the amount of free disk space on a given partition, the amount of CPU in use, and so forth.
- Counter: a value which always increases. This might be something like the number of bytes sent by a network card — the value only resets when the network card is reset (probably by a reboot). These only-increasing types are valuable because its easier to do maths on them in the monitoring system.
- Histograms: a set of values broken into buckets. For example, the response time for a given web page would probably be reported as a histogram. We’ll discuss histograms in more detail in a later post.
I don’t really want to dig too deeply into the value types right now, apart from explaining that our previous examples haven’t specified a type for the metrics being provided, and that this is undesirable. For now we just need to decide if the value goes up and down (a gauge) or just up (a counter). You can read more about prometheus types at https://prometheus.io/docs/concepts/metric_types/ if you want to.
A typed example
So now we can go back and do the same thing as before, but we can do it with typing like adults would. Let’s assume that the value of pi is a gauge, and goes up and down depending on the vagaries of space time. Let’s also show that we can add a second metric at the same time because we’re fancy like that. We’d therefore need to end up doing something like (again heavily based on the contents of the README):
cat <<EOF | curl --data-binary @- http://pushgateway.example.org:9091/metrics/job/frontend/instance/0
# TYPE some_metric gauge
# HELP approximate value of pi in the current space time continuum
some_metric 3.14
# TYPE another_metric counter
# HELP another_metric Just an example.
another_metric 2398
EOF
And we’d end up with values like this in the pushgateway metrics URL:
# TYPE some_metric gauge
some_metric{instance="0",job="frontend"} 3.14
# HELP another_metric Just an example.
# TYPE another_metric counter
another_metric{instance="0",job="frontend"} 2398
A tangible example
So that’s a lot of talking. Let’s deploy this in my home lab for something actually useful. The node_exporter does not report any SMART health details for disks, and that’s probably a thing I’d want to alert on. So I wrote this simple script:
#!/bin/bash

hostname=`hostname | cut -f 1 -d "."`

for disk in /dev/sd[a-z]
do
  disk=`basename $disk`

  # Is this a USB thumb drive?
  if [ `/usr/sbin/smartctl -H /dev/$disk | grep -c "Unknown USB bridge"` -gt 0 ]
  then
    result=1
  else
    result=`/usr/sbin/smartctl -H /dev/$disk | grep -c "overall-health self-assessment test result: PASSED"`
  fi

  cat <<EOF | curl --data-binary @- http://localhost:9091/metrics/job/$hostname/instance/$disk
  # TYPE smart_health_passed gauge
  # HELP whether or not a disk passed a "smartctl -H /dev/sdX"
  smart_health_passed $result
EOF
done
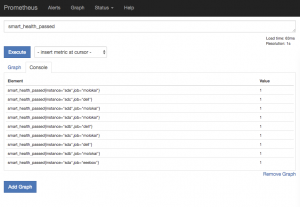
Now, that’s not perfect and I am sure that I’ll re-write this in python later, but it is actually quite useful already. It will report if a SMART health check failed, and now I could write an alerting rule which looks for disks with a health value of 0 and send myself an email to go to the hard disk shop. Once your pushgateways are being scraped by prometheus, you’ll end up with something like this in the console:

I’ll explain how to turn this into alerting later.