I want to be able to see the level of change between OpenStack releases. However, there are a relatively small number of changes with simply huge amounts of delta in them — they’re generally large refactors or the delete which happens when part of a repository is spun out into its own project.
I therefore wanted to explore what was a reasonable size for a change in OpenStack so that I could decide what maximum size to filter away as likely to be a refactor. After playing with a couple of approaches, including just randomly picking a number, it seems the logical way to decide is to simply plot a histogram of the various sizes, and then pick a reasonable place on the curve as the cutoff. Due to the large range of values (from zero lines of change to over a million!), I ended up deciding a logarithmic axis was the way to go.
For the projects listed in the OpenStack compute starter kit reference set, that produces the following histogram: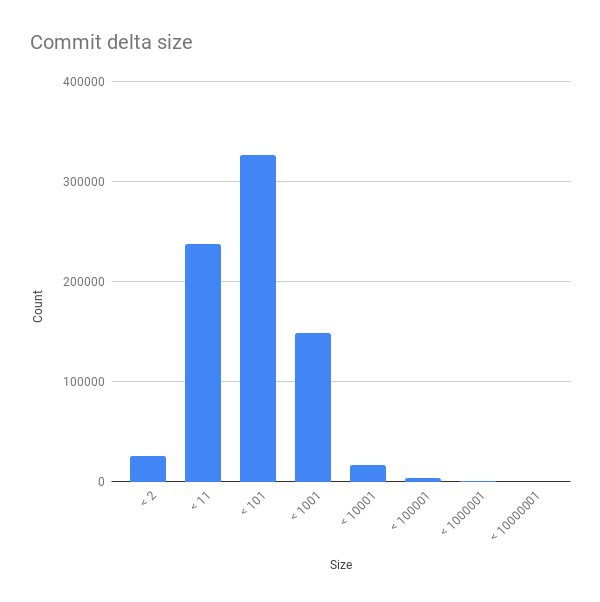 I feel that filtering out commits over 10,000 lines of delta feels justified based on that graph. For reference, the raw histogram buckets are: